

Rendering optimisation begins with a measured bottleneck, not a target draw-call number. A frame can be limited by main-thread submission, render-thread work, vertex processing, fragment shading, bandwidth, synchronisation, memory or something outside graphics. Reducing submissions may help a CPU-bound scene while doing little for a fill-rate-bound scene.
In Unity, “batching” names several different mechanisms with different render-pipeline, material, mesh and platform constraints. Current Unity guidance recommends choosing among SRP Batcher, GPU Resident Drawer, GPU instancing and static batching based on the active pipeline and content. Dynamic batching is no longer generally recommended as a default optimisation (Unity — Choose a method for optimising draw calls).
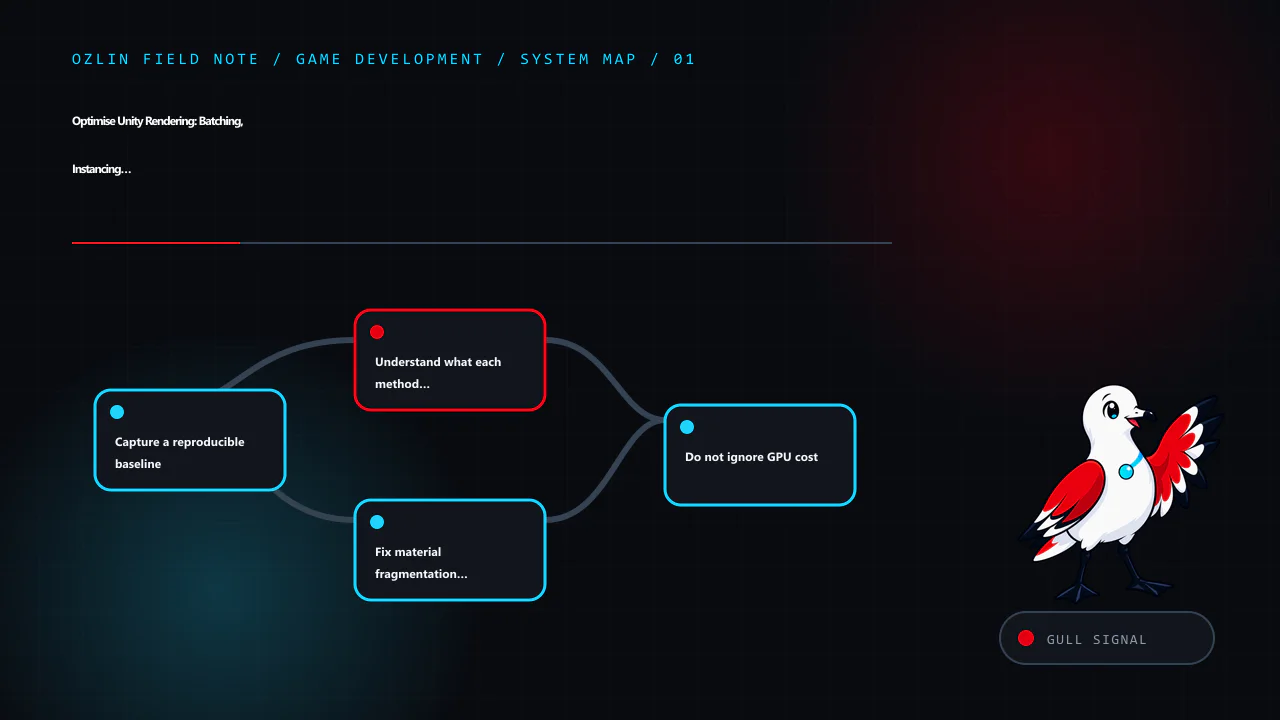
Capture a reproducible baseline
Choose a scene and camera path representative of the shipping game. Record:
- exact Unity editor and package versions;
- render pipeline, renderer and graphics API;
- target device, resolution, quality profile and thermal state;
- development or release build configuration;
- frame-time distribution, not just average frames per second;
- main-thread and render-thread time;
- GPU frame time and expensive passes;
- batches, set-pass calls, triangles and vertices; and
- memory, loading and visual output.
Profile a player build on target hardware. Editor overhead, attached tools and a desktop GPU can change the result. Unity's Profiler and Frame Debugger answer different questions: the Profiler shows time and counters, while the Frame Debugger steps through rendering events and state changes (Unity — Rendering Profiler module, Unity — Frame Debugger).
Take screenshots or exports of the baseline and create an acceptance threshold. Without the baseline, a lower batch count can disguise higher memory, worse culling or a slower shader.
Understand what each method reduces
SRP Batcher
The Scriptable Render Pipeline Batcher reduces CPU work associated with preparing compatible shader state. Unity explicitly notes that it does not reduce the number of draw calls. It is available for compatible shaders in URP, HDRP and custom SRPs. Material and shader design determine compatibility (Unity — SRP Batcher).
SRP Batcher is often a sensible baseline for SRP projects, but verify compatibility in the Frame Debugger and profiler. Per-renderer material overrides can change which path Unity uses; current Unity documentation warns that MaterialPropertyBlock can make a renderer incompatible with SRP Batcher in URP or HDRP.
GPU Resident Drawer
In supported URP and HDRP configurations, GPU Resident Drawer moves eligible renderer data into GPU-resident structures and uses GPU instancing. It can reduce CPU submission work for many objects, but has compatibility conditions. Check renderer types, shader support, lighting and platform constraints in the documentation for the pinned Unity version.
GPU instancing
GPU instancing renders many copies of the same mesh and material in a small number of draw submissions while varying supported per-instance data. It suits repeated props, foliage or crowds when meshes and materials align. Instance data, culling granularity, transparent sorting and shader work still cost time. Unity documents that an object uses one draw-call optimisation method according to priority rather than combining all mechanisms at once (Unity — GPU instancing).
Static batching
Static batching combines geometry for objects that do not move, reducing submission work at the cost of additional memory and build or load considerations. It is the primary batching path Unity identifies for the Built-in Render Pipeline. Marking everything static can increase memory and reduce flexibility; compare the built player, not only the Scene view.
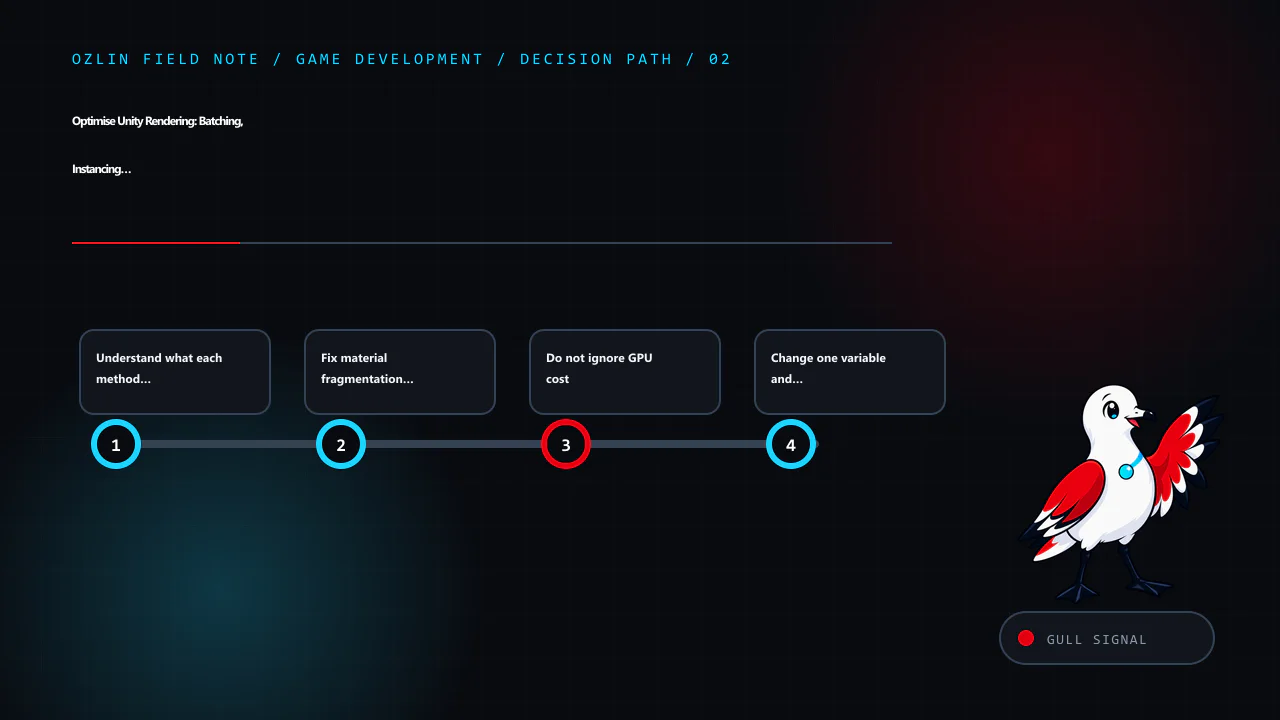
Fix material fragmentation before chasing switches
Objects that look identical may use separate material instances, shader keywords or render states. Audit:
- duplicated materials and textures;
- accidental
renderer.materialuse that creates an instance; - shader variants and keyword combinations;
- lightmap and probe requirements;
- transparency, render queues and sorting;
- per-object properties; and
- mesh and submesh layout.
Use shared materials where the visual requirement allows it. Texture arrays or atlases can reduce state changes in some content, but they add import, filtering, mip, UV and authoring constraints. Measure memory and visual quality before adopting them.
Reducing materials can also reduce creative flexibility. Document which differences are intentional and which are pipeline accidents.
Do not ignore GPU cost
A perfectly submitted frame can still be slow because too many pixels or expensive shader operations are executed. Transparent particles, layered user interfaces, full-screen effects, high-resolution shadows and overdraw are common causes. Optimise the pass shown by the GPU profiler or platform capture.
Possible interventions include:
- reduce overlapping transparent area;
- lower shader or lighting complexity for the target tier;
- use level of detail and occlusion where measured benefit exceeds overhead;
- reduce shadow casters, resolution or distance;
- render suitable effects at reduced resolution; and
- adjust dynamic resolution or quality profiles with visual tests.
Triangle count alone is not a reliable performance diagnosis. Very small meshes can be submission-bound, while a single full-screen shader can be fragment-bound. Track CPU and GPU frame times together.
Change one variable and retest
A useful experiment has a hypothesis, a controlled change and acceptance evidence. For example:
Hypothesis: repeated street props are CPU render-thread bound because they share meshes but use fragmented materials. Consolidating compatible materials and enabling the supported instancing path will reduce high-percentile render-thread time without unacceptable memory or visual change.
Capture before and after data from the same build path and camera. Inspect Frame Debugger events to confirm the intended path was used. Run screenshot comparison and gameplay review; an optimisation that breaks lightmaps, animation or material variation is a regression.
Then test representative low, middle and high tiers. Driver and graphics-API behaviour differ. Keep a rollback and record why the chosen configuration exists so a future package upgrade does not silently undo it.
For help building a graphics profile, content budget or target-device test plan, see Ozlin Info's game-development services or contact Ozlin Info.
Related reading: Particle systems with measured effects budgets.
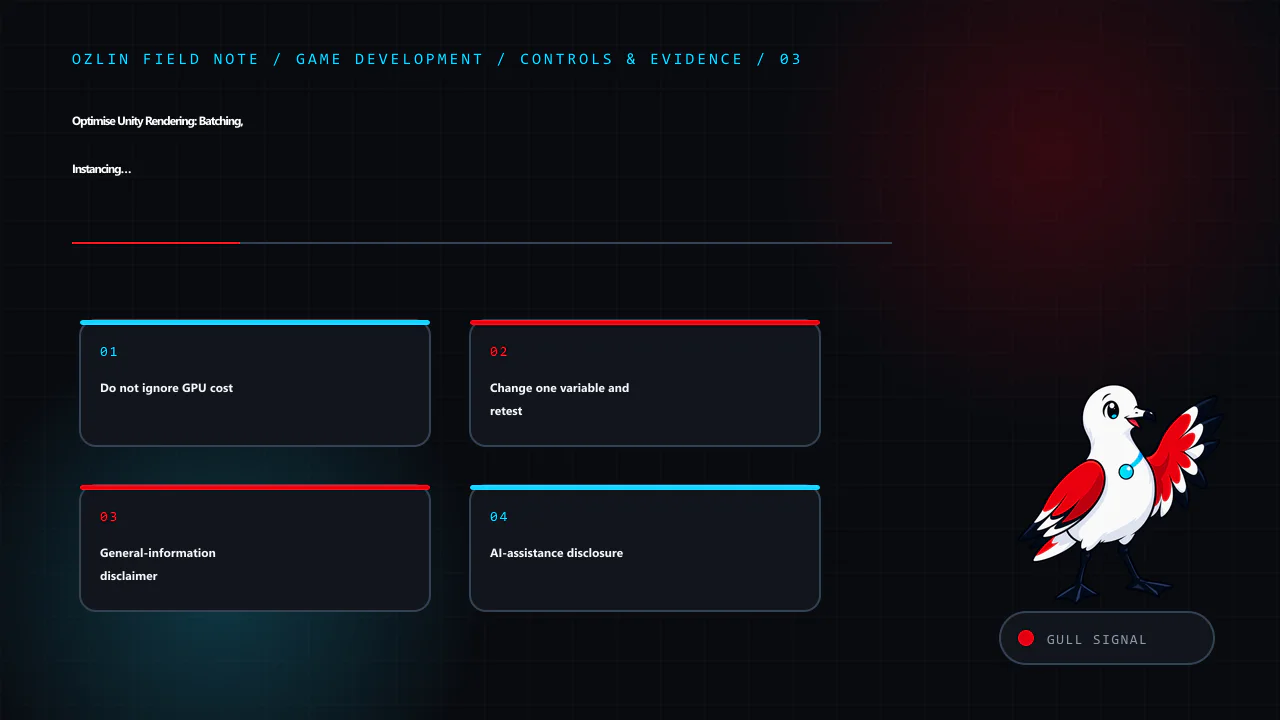
General-information disclaimer
This article provides general technical information. Performance depends on the exact Unity version, pipeline, shaders, content, platform and driver; no optimisation outcome or platform approval is guaranteed.
AI-assistance disclosure
AI tools assisted with source discovery, outlining and copyediting. A human reviewer must profile a pinned player build, inspect the active rendering path and approve visual and memory trade-offs before publication or release.

Primary sources checked
- Unity — Choose a method for optimising draw calls
- Unity — SRP Batcher
- Unity — GPU instancing
- Unity — Rendering Profiler module
- Unity — Frame Debugger
Source access date: 29 August 2026.