
Tag: web performance

  • MySQL and WordPress Database Performance: Measure Before You Tune

    MySQL and WordPress Database Performance: Measure Before You Tune

    Database tuning begins with a slow user journey and evidence—not a generic cleanup button. A page can wait on PHP, remote APIs, object storage, locks, a cold cache or the browser while the database is behaving normally. Conversely, a fast average can hide one expensive query that affects only administrators or a particular filter.

    For WordPress backed by MySQL, the safest workflow is to reproduce the affected task, measure where time and resources are spent, inspect the responsible query and application call path, make one controlled change, then compare the same evidence.
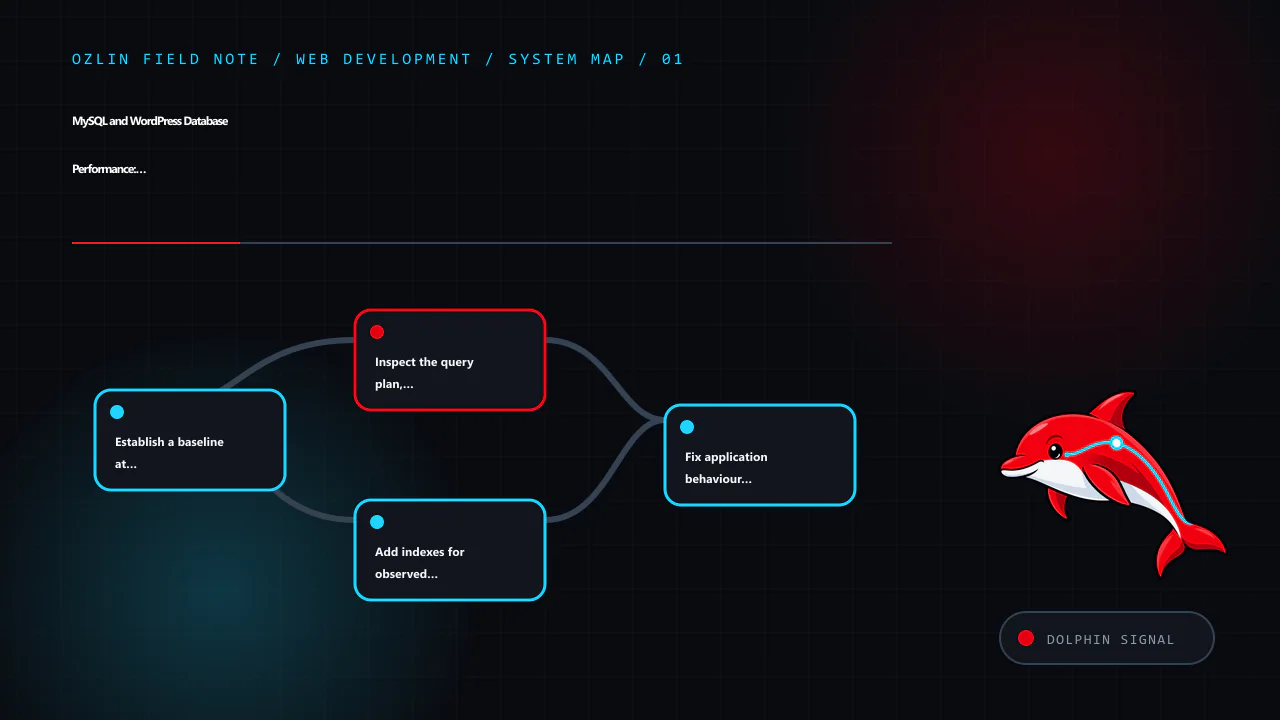
    Article map for MySQL and WordPress Database Performance: Measure Before You Tune, covering Establish a baseline at the user and server layers, Inspect the query plan, not just the SQL text, Add indexes for observed acc…
    Article map: Establish a baseline at the user and server layers; Inspect the query plan, not just the SQL text; Add indexes for observed access patterns; Fix application behaviour before increasing server limits.

    Establish a baseline at the user and server layers

    Record the exact journey, data volume, account role, cache state and time window. Useful observations include:

    • response time at the reverse proxy and application;
    • database query count and cumulative time for the request;
    • slow-query frequency, rows examined and lock time;
    • CPU, memory, disk latency and connection pressure;
    • cache hit and miss behaviour;
    • background jobs or cron activity; and
    • whether the problem occurs on a cold cache, warm cache or both.

    Use production telemetry with appropriate data minimisation, access controls and retention. Reproduce in staging with representative synthetic data when a diagnostic action could add risk or load.

    MySQL's slow query log records statements exceeding long_query_time and can also apply a minimum examined-row threshold. It is a diagnostic source, not something to enable indefinitely without considering volume, sensitive values and storage (MySQL 8.4 — Server Logs). Application performance monitoring can connect a query to a route or request, but inspect how it captures parameters before sending database details to a third party.

    Inspect the query plan, not just the SQL text

    EXPLAIN shows how the optimiser intends to execute a statement, including access type, candidate and selected indexes, join order and estimated rows. EXPLAIN ANALYZE actually runs a supported statement and adds observed iterator timing, row counts and loops. Because it executes the work, use it deliberately—prefer a safe staging environment or a carefully reviewed read query on production (MySQL 8.4 — EXPLAIN).

    Look for evidence such as:

    • far more rows examined than returned;
    • full scans that grow with the table;
    • repeated nested-loop work;
    • sorting or temporary processing on a large result;
    • poor estimates compared with actual rows; and
    • filters or joins that cannot use an appropriate index.

    A full scan is not automatically wrong. It may be optimal for a small table or a query returning much of the table. The question is whether the plan fits the data and workload.

    If estimates appear stale after major data changes, ANALYZE TABLE can refresh statistics. InnoDB determines cardinality estimates using sampled index dives, so estimates are not exact and repeated analysis can produce different values (MySQL 8.4 — ANALYZE TABLE). Do not use ANALYZE TABLE as a ritual without an identified planning problem and change controls.

    Add indexes for observed access patterns

    An index can reduce rows examined for filters, joins and ordered retrieval. It also occupies storage and must be maintained on insert, update and delete. MySQL explicitly cautions that unnecessary indexes waste space and increase write work (MySQL 8.4 — Optimization and Indexes).

    For a candidate composite index, consider:

    • columns used together in equality and range predicates;
    • join columns and data types;
    • sort order and limit;
    • selectivity in the real dataset;
    • the leftmost-prefix behaviour of a B-tree index;
    • existing overlapping indexes; and
    • impact on writes and maintenance.

    Test the plan and workload before and after. A forced index hint can mask stale statistics or an incomplete model and may become harmful as data changes.

    In WordPress, do not alter core table structures casually. A plugin query may need an application-level redesign, a supported plugin index or a purpose-built table rather than another index on wp_postmeta. Meta queries across large, weakly selective values can remain expensive even after a plausible index is added.
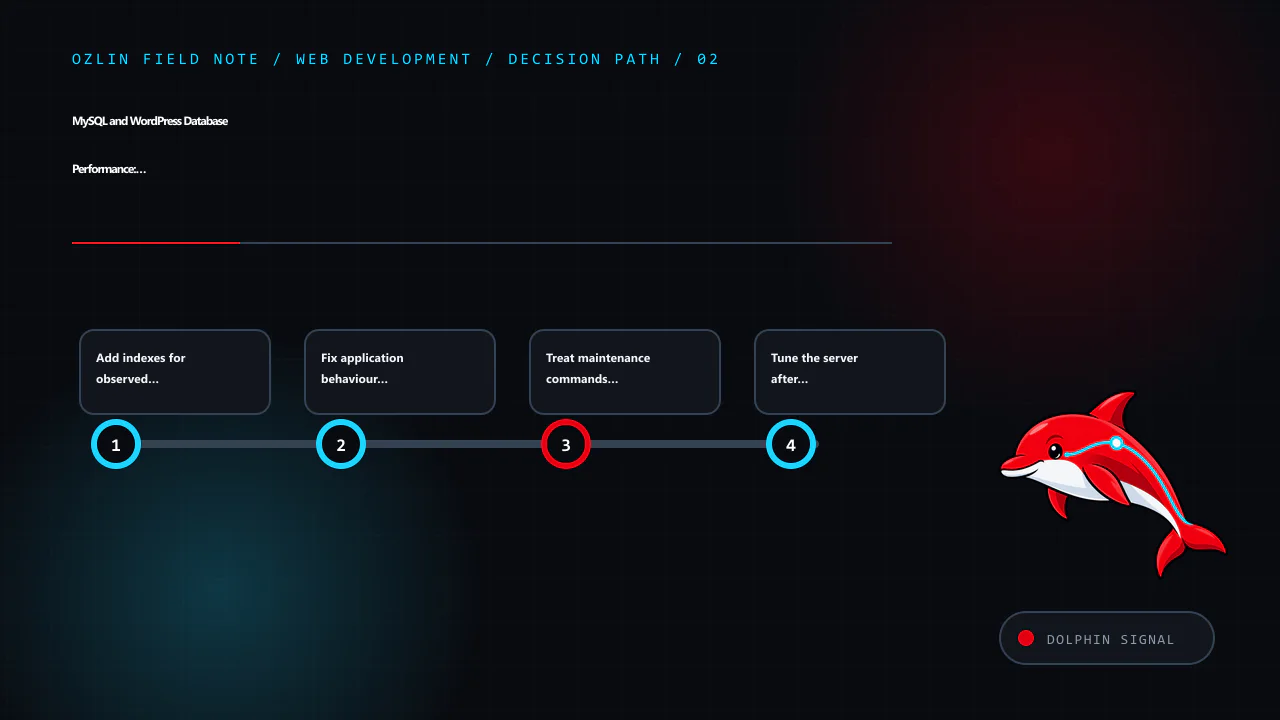
    Decision path for MySQL and WordPress Database Performance: Measure Before You Tune, covering Add indexes for observed access patterns, Fix application behaviour before increasing server limits, Treat maintenance comman…
    Decision path: Add indexes for observed access patterns; Fix application behaviour before increasing server limits; Treat maintenance commands as changes; Tune the server after the workload is understood.

    Fix application behaviour before increasing server limits

    Common application problems include:

    • an N+1 pattern that fetches related records one at a time;
    • selecting unused columns or unlimited result sets;
    • running the same query repeatedly during one request;
    • loading large option values on every page;
    • synchronous work that belongs in a bounded background job;
    • remote calls inside a database transaction; and
    • missing pagination or an unbounded administrative report.

    Correcting one query pattern is usually more durable than allocating more memory to execute it faster. Use the WordPress APIs and prepared queries rather than constructing SQL from untrusted input. Performance work must not weaken authorisation or validation.

    Review WordPress autoloaded options

    Autoloaded options are loaded with every WordPress request. A plugin or theme can leave large or obsolete values in wp_options, increasing memory and transfer work across the site. WordPress's current administration guidance says excessive autoloaded options can slow a site and gives a general target of keeping them below 800 KB, but treat that number as an investigation trigger rather than a universal guarantee (WordPress — Optimization).

    Inventory the largest autoloaded values, identify their owner and confirm whether they are required on most requests. Do not directly delete unfamiliar rows. Some values are active configuration or serialised structures; an unsupported change can break the site.

    Cache only where correctness is defined

    WordPress's Transients API stores temporary cached data with an expiration. A transient may disappear before its nominal expiry, so the application must be able to regenerate it (WordPress — Transients API). A persistent object cache can reduce repeated database reads across requests, but it introduces capacity, eviction, invalidation and operational dependencies.

    For each cached value, define:

    • the key and tenant or user scope;
    • maximum acceptable staleness;
    • invalidation triggers;
    • behaviour on a miss or cache outage;
    • size and retention; and
    • whether personal or confidential data is appropriate to store.

    Do not cache an authorisation decision longer than the underlying access can safely remain valid. Avoid cache keys that let one user's result reach another.

    Treat maintenance commands as changes

    OPTIMIZE TABLE is often advertised as routine WordPress cleanup. For InnoDB, MySQL maps it to ALTER TABLE ... FORCE, rebuilding the table to update statistics and reclaim unused space in the clustered index (MySQL 8.4 — OPTIMIZE TABLE). A rebuild can require time, I/O, temporary space and operational coordination. Run it only for an evidenced need with backups, capacity checks and an understood locking/online-DDL path.

    Deleting expired transients, old revisions or logs may reduce storage, but retention must be intentional. Confirm plugin behaviour, legal or business requirements and rollback before removing records. Database “repair” plugins with broad write access add their own supply-chain and operational risk.

    Tune the server after the workload is understood

    MySQL buffer, connection and I/O settings depend on engine, dataset, concurrency, available memory and other services on the host. Copying a large-server configuration into a small container can trigger swapping or out-of-memory termination. Container memory limits do not make oversized MySQL settings safe.

    Measure the working set, peak connections, temporary object use, disk latency and buffer-pool behaviour. Change one group of settings with a hypothesis and compare during a representative period. Preserve capacity for the operating system, web workers, caches and backup jobs.

    Connection pooling or persistent connections can reduce setup overhead but also multiply idle sessions or stale transactions if application workers and limits are not coordinated.
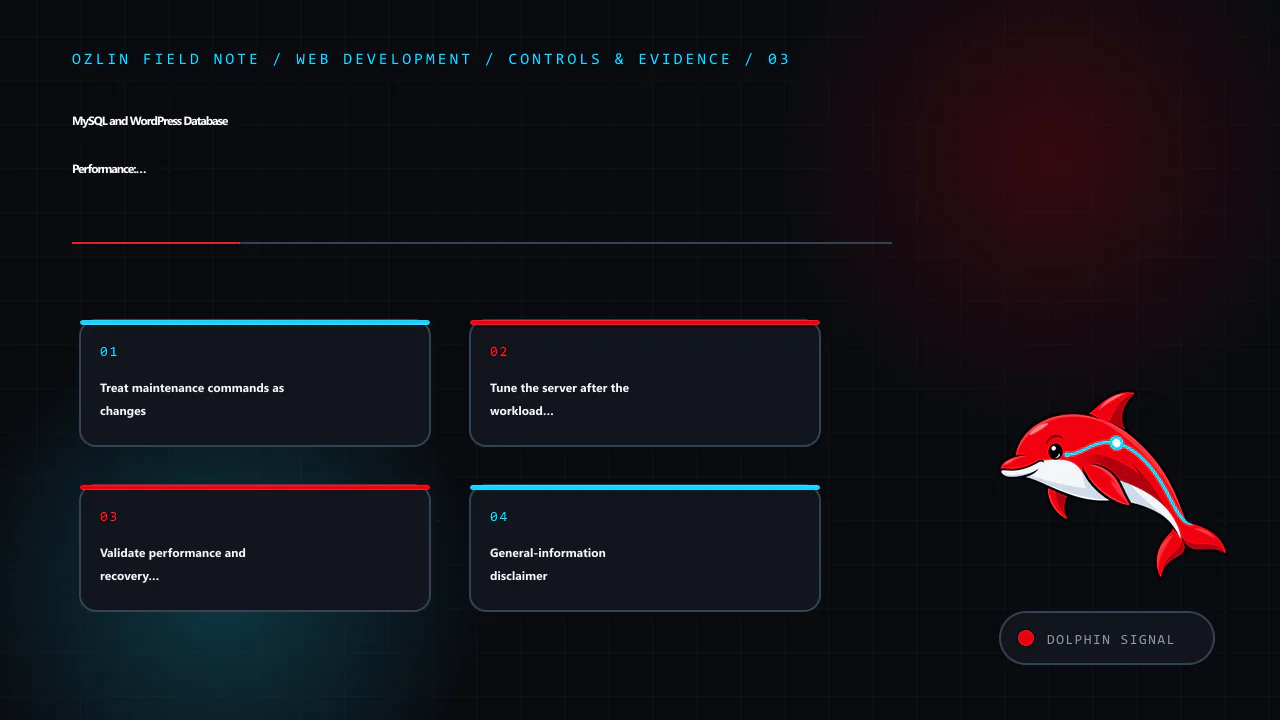
    Control and evidence map for MySQL and WordPress Database Performance: Measure Before You Tune, covering Treat maintenance commands as changes, Tune the server after the workload is understood, Validate performance and…
    Control and evidence map: Treat maintenance commands as changes; Tune the server after the workload is understood; Validate performance and recovery together; General-information disclaimer.

    Validate performance and recovery together

    Before a schema, cleanup or configuration change:

    1. take a database-consistent backup using a supported method;
    2. verify available disk and temporary space;
    3. record the original configuration and plan;
    4. test the change and rollback in a representative environment;
    5. deploy during an appropriate window; and
    6. verify both the target journey and unrelated critical workflows.

    A backup is credible only after a restore test. Monitor for regressions in writes, replication if used, background jobs and cache behaviour—not just the one query that improved.

    For help profiling a WordPress application or planning a scoped performance change, see Ozlin Info's web development services or contact Ozlin Info.

    Related reading: 10 WordPress performance checks before optimisation.


    General-information disclaimer

    This article provides general technical information only. Commands and settings must be assessed against the actual database version, workload, data, hosting design and recovery requirements. Performance changes can cause downtime or data loss if applied without appropriate review and backups.

    AI-assistance disclosure

    AI tools assisted with source discovery, outlining and copyediting. A human reviewer must verify all database statements, operational assumptions, service claims and the publication decision before release. No performance improvement or availability outcome is guaranteed.
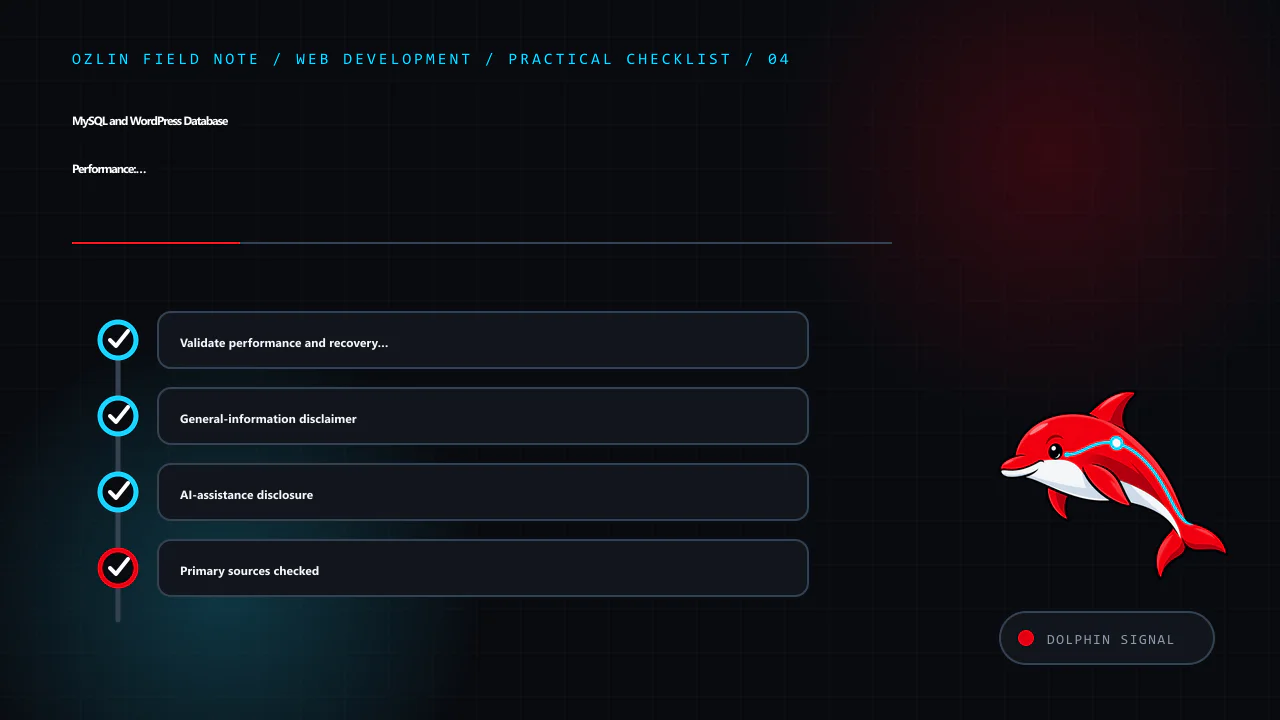
    Practical checklist for MySQL and WordPress Database Performance: Measure Before You Tune, covering Validate performance and recovery together, General-information disclaimer, AI-assistance disclosure and related review…
    Practical checklist: Validate performance and recovery together; General-information disclaimer; AI-assistance disclosure; Primary sources checked.

    Primary sources checked

    Source access date: 29 August 2026.
  • Web Performance: Diagnose Real User Experience Before Optimising

    Web Performance: Diagnose Real User Experience Before Optimising

    Web performance is the experience of waiting for useful content, interacting with it and keeping the page visually stable. It is not one synthetic score and not a one-time compression exercise. Device capability, network, geography, cache state, account state and page content all affect what a visitor experiences.

    The most productive workflow is evidence-led: identify a slow user task, measure it in the field, reproduce it in a controlled lab, find the limiting part, make one change and confirm the result for real users.

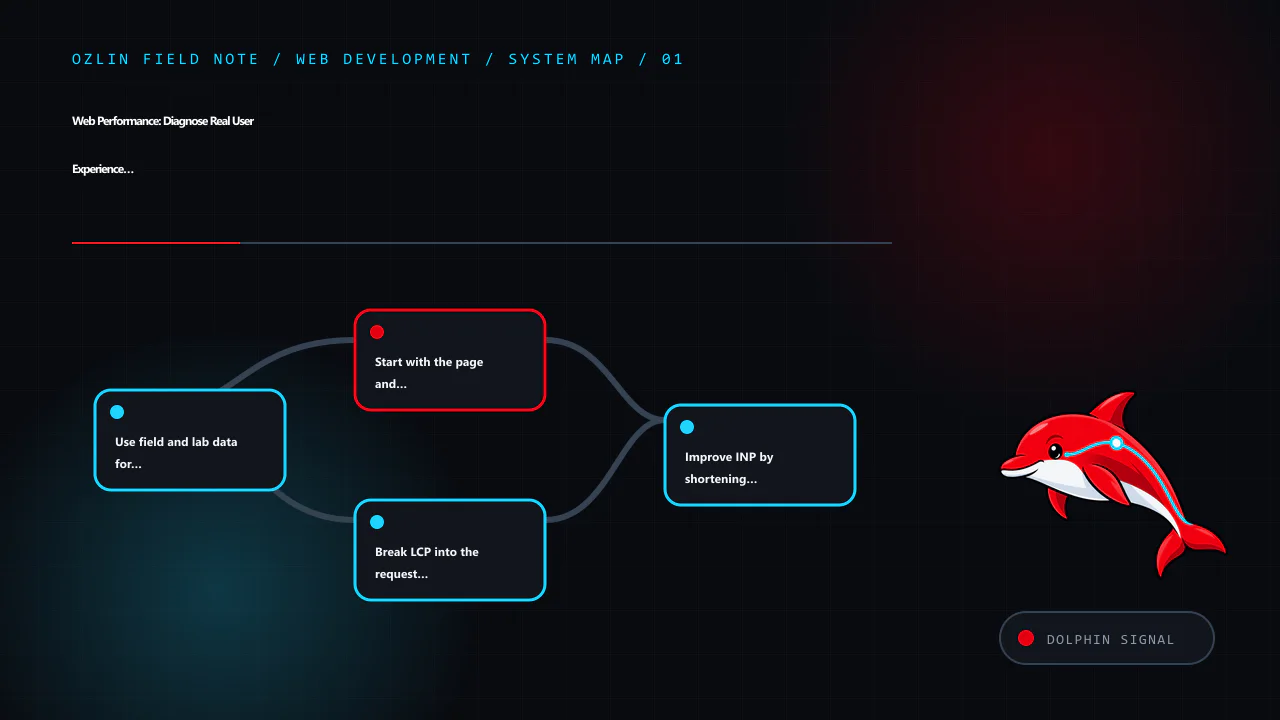
    Article map for Web Performance: Diagnose Real User Experience Before Optimising, covering Use field and lab data for different questions, Start with the page and task that matters, Break LCP into the request and render…
    Article map: Use field and lab data for different questions; Start with the page and task that matters; Break LCP into the request and rendering path; Improve INP by shortening main-thread work.

    Use field and lab data for different questions

    Field data describes visits on real devices and networks. It can show distributions, route differences and whether a problem affects mobile users, a region or a particular template. Lab tools make the environment repeatable and expose network waterfalls, main-thread work, layout shifts and rendering detail.

    Neither replaces the other. A lab run cannot represent every customer, while a field percentile rarely tells a developer exactly which script or image caused the delay.

    For Core Web Vitals, evaluate the 75th percentile of page visits separately for mobile and desktop where the data permits it. Current “good” thresholds are:

    Metric What it represents Good threshold
    Largest Contentful Paint (LCP) Loading of the largest visible content element 2.5 seconds or less
    Interaction to Next Paint (INP) Overall responsiveness to click, tap and keyboard interactions 200 milliseconds or less
    Cumulative Layout Shift (CLS) Unexpected visual movement 0.1 or less

    These thresholds are guidance for classifying experience, not a guarantee of usability, conversion or search position. A site can meet them and still have an inaccessible form, broken checkout or slow task after the measured page state (web.dev — LCP; web.dev — INP; web.dev — CLS).

    Start with the page and task that matters

    Segment by template and journey before optimising the global average. A home page, article, product listing and logged-in dashboard have different content and dependencies. Record:

    • target URL and navigation path;
    • device and viewport;
    • network and geographic path;
    • cold and warm cache;
    • consent and authentication state;
    • content or experiment variant; and
    • field time range and sample size.

    Define a performance budget for assets and behaviour: maximum initial JavaScript, image bytes, third-party requests, font files, server response and long tasks. A budget makes performance reviewable during delivery rather than a rescue project after launch.

    Break LCP into the request and rendering path

    LCP includes time before the HTML arrives, delay before the LCP resource starts loading, the resource transfer and delay before the browser paints it. Improve the dominant part instead of applying generic minification.

    Reduce server and connection delay

    Trace DNS, TLS, redirects, edge routing, reverse proxy, application, database and remote APIs. Remove avoidable redirects, cache safe public responses, keep the application and database appropriately close, and fix slow queries or synchronous external calls. A content delivery network can shorten delivery for cacheable resources but does not repair slow origin generation or incorrect cache rules.

    Measure time to first byte in context. A fast synthetic response from a nearby location does not represent a personalised request from another region.

    Make the LCP resource discoverable

    If the main image is only inserted after JavaScript runs or hidden in a CSS background, the browser may discover it late. Put important content in the initial HTML where appropriate, use responsive image markup and avoid lazy-loading an above-the-fold LCP image. Apply priority hints only after confirming discovery order; prioritising everything means nothing is prioritised.

    Serve an image with dimensions and an appropriate intrinsic size. Compare AVIF, WebP and conventional fallbacks at acceptable visual quality instead of assuming one format always wins.

    Remove render delay

    Limit render-blocking CSS to what the initial view needs, keep style rules maintainable and defer non-critical work. Font loading, large client-rendered bundles and long main-thread tasks can delay paint even after the resource arrived. Server-rendered or statically generated content may improve time to content when a marketing or article page does not need a client-only application.

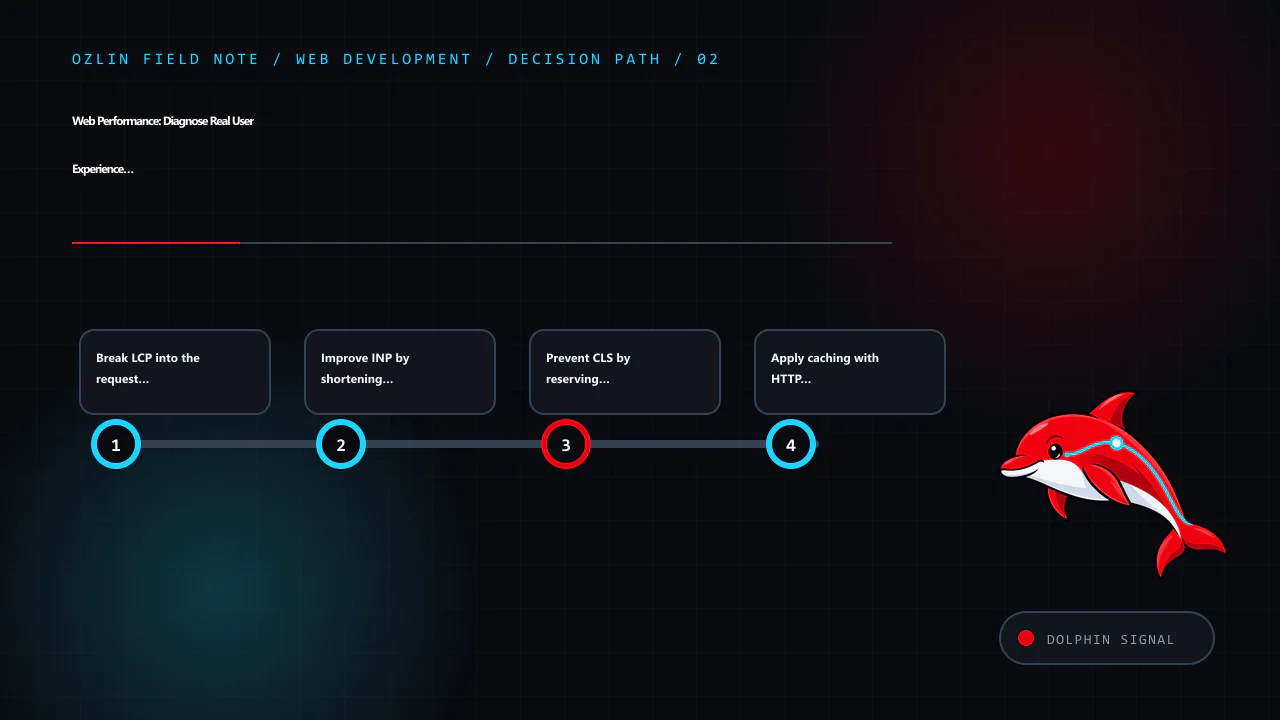
    Decision path for Web Performance: Diagnose Real User Experience Before Optimising, covering Break LCP into the request and rendering path, Improve INP by shortening main-thread work, Prevent CLS by reserving space and…
    Decision path: Break LCP into the request and rendering path; Improve INP by shortening main-thread work; Prevent CLS by reserving space; Apply caching with HTTP semantics.

    Improve INP by shortening main-thread work

    INP observes interaction latency across the page visit and usually reports the worst interaction, with an outlier adjustment for pages with many interactions. A slow interaction can include input delay, event-handler work and delay before the next paint.

    Profile the actual slow interaction. Common improvements include:

    • remove unused third-party and application JavaScript;
    • split long tasks and yield so the browser can update;
    • avoid repeated synchronous layout reads and writes;
    • render or virtualise only the visible part of a large list;
    • debounce or schedule non-essential work without delaying critical feedback;
    • move suitable computation to a worker; and
    • show immediate, accessible feedback while longer work continues.

    Do not make an interface appear responsive by acknowledging a destructive action before the server has safely accepted it. Performance must preserve correctness and communicate pending, success and failure states.

    Third-party tags, chat widgets, A/B tests and consent tools execute in the same page. Give each an owner, purpose and performance budget; remove campaigns and integrations that are no longer used.

    Prevent CLS by reserving space

    CLS measures unexpected movement, not animation in general. Common causes include images without dimensions, late ads or embeds, injected banners and font changes.

    Set width and height or an aspect ratio for images and video. Reserve realistic space for embeds, cookie notices and dynamic results. Insert new content below the current focus where possible, or allocate its space before an asynchronous response arrives. Use font metrics and fallbacks that reduce reflow.

    A layout shift immediately following a user action may be excluded from the metric, but it can still be confusing or move a control away from a keyboard or magnification user. Review the experience, not just the number.

    Apply caching with HTTP semantics

    Cache versioned static assets for a long period and change their URL when content changes. For HTML and API responses, define freshness, validators and private/shared behaviour based on the data. Cache-Control: no-store, private, Vary, ETags and conditional requests have distinct semantics; a broad CDN “cache everything” rule can expose personalised content.

    RFC 9111 describes an HTTP cache key as including at least the method and target URI, with additional request fields where selected by Vary (RFC 9111 — HTTP Caching). Test authenticated, consent, language and device variants before enabling shared caching.

    A service worker adds another cache with its own lifecycle. Use it only for a defined reliability goal and plan invalidation; it can serve stale or incompatible code if updates are mishandled.

    Optimise images, fonts and CSS as systems

    For images:

    • choose dimensions for the rendered slot and device density;
    • use srcset and sizes so the browser can select a candidate;
    • compare codecs at representative quality;
    • lazy-load below-the-fold images, not the primary LCP image;
    • preserve width and height; and
    • remove metadata only where it is not required.

    For fonts, use only needed families, weights and character sets, preload sparingly and choose an appropriate font-display strategy. System fonts can be a strong option where brand requirements allow. Ensure fallbacks do not create severe layout shifts.

    For CSS, remove truly unused rules with a build process that understands dynamic class names. Do not trade maintainability or accessibility for a tiny byte reduction without measurable benefit.

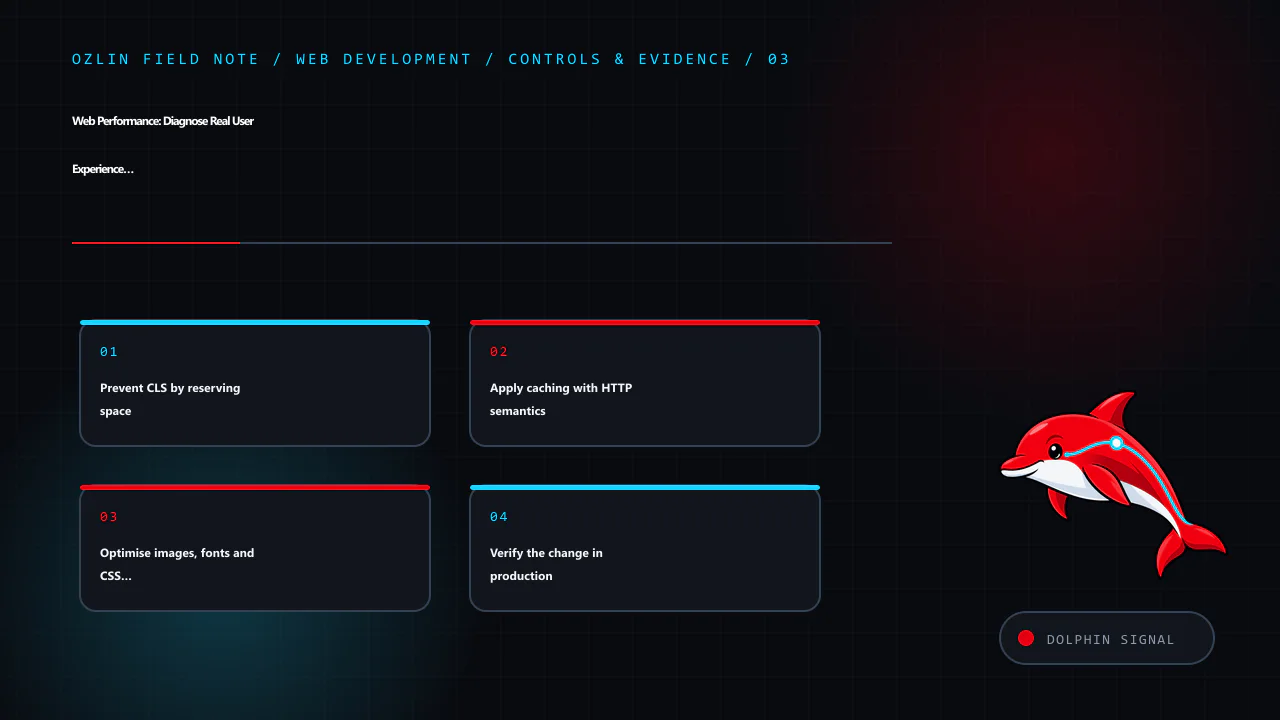
    Control and evidence map for Web Performance: Diagnose Real User Experience Before Optimising, covering Prevent CLS by reserving space, Apply caching with HTTP semantics, Optimise images, fonts and CSS as systems and re…
    Control and evidence map: Prevent CLS by reserving space; Apply caching with HTTP semantics; Optimise images, fonts and CSS as systems; Verify the change in production.

    Verify the change in production

    After deployment:

    1. check errors, availability and critical tasks;
    2. compare controlled lab traces under the same conditions;
    3. watch field distributions long enough to account for cache and traffic mix;
    4. check slower devices and regions, not only the median;
    5. verify accessibility, analytics and consent behaviour; and
    6. keep rollback available.

    Core Web Vitals field data may move gradually as new visits enter the reporting window. Use your own real-user monitoring for faster diagnostics, with appropriate privacy and sampling controls.

    For help auditing a WordPress or custom website performance path, see Ozlin Info's web development services or contact Ozlin Info.

    Related reading: MySQL and WordPress database performance: measure before you tune.


    General-information disclaimer

    This article provides general technical information only. Performance results depend on the actual site, users, devices, networks and measurement design. Core Web Vitals targets do not guarantee accessibility, revenue, search position or business outcomes.

    AI-assistance disclosure

    AI tools assisted with source discovery, outlining and copyediting. A human reviewer must verify the current metric definitions, technical recommendations, service claims and publication decision before release. No performance or ranking outcome is guaranteed.

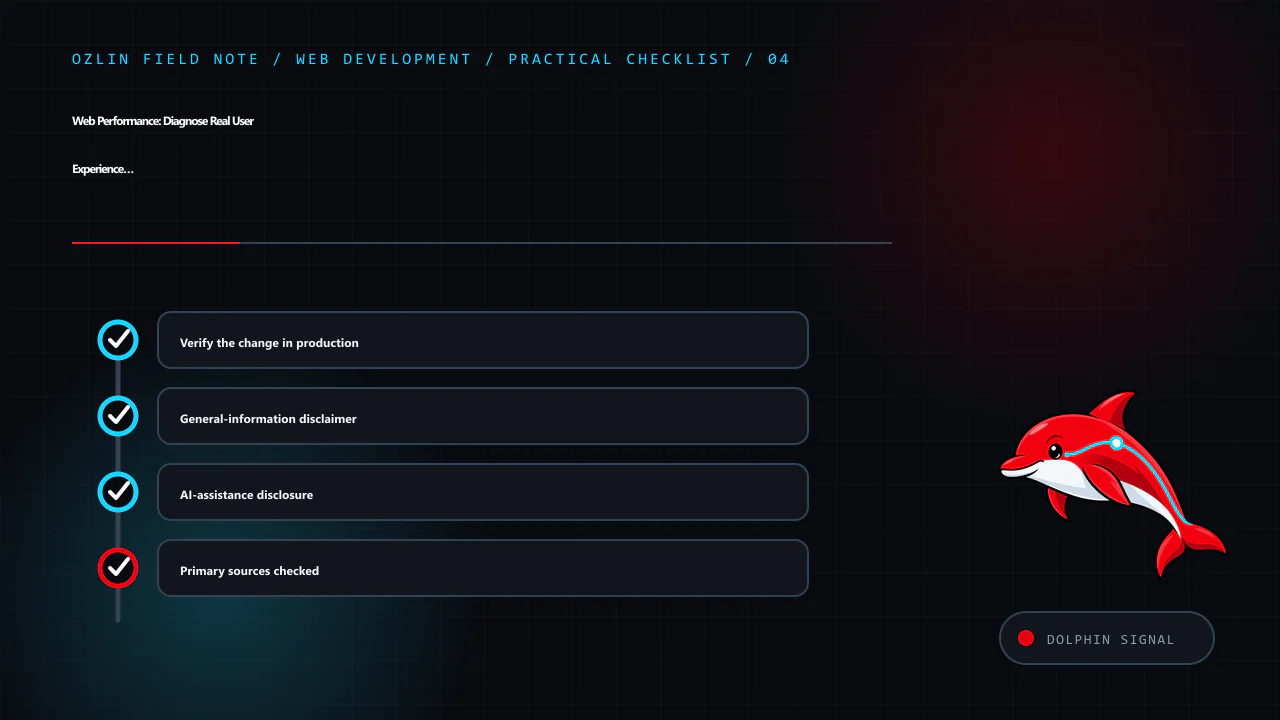
    Practical checklist for Web Performance: Diagnose Real User Experience Before Optimising, covering Verify the change in production, General-information disclaimer, AI-assistance disclosure and related review points.
    Practical checklist: Verify the change in production; General-information disclaimer; AI-assistance disclosure; Primary sources checked.

    Primary sources checked

    Source access date: 29 August 2026.